オブジェクトブラウザーは VBA の羅針盤である.しかし時に役に立たないことがある.今回はグラフの軸の書式設定でハマった経緯を備忘録として記しておく.
マクロの記録から
VBA の挙動を調べるにはマクロの記録から入るのが普通である.使われているオブジェクトを特定し,オブジェクトブラウザーからプロパティとメソッドを調べてオブジェクト間の繋がりを丹念に紐解いていく.面倒でもこの作業は欠かせない.
ユーザーインターフェース
Y 軸を選択した状態で右クリックして「軸の書式設定…」を選ぶ.

軸の書式設定
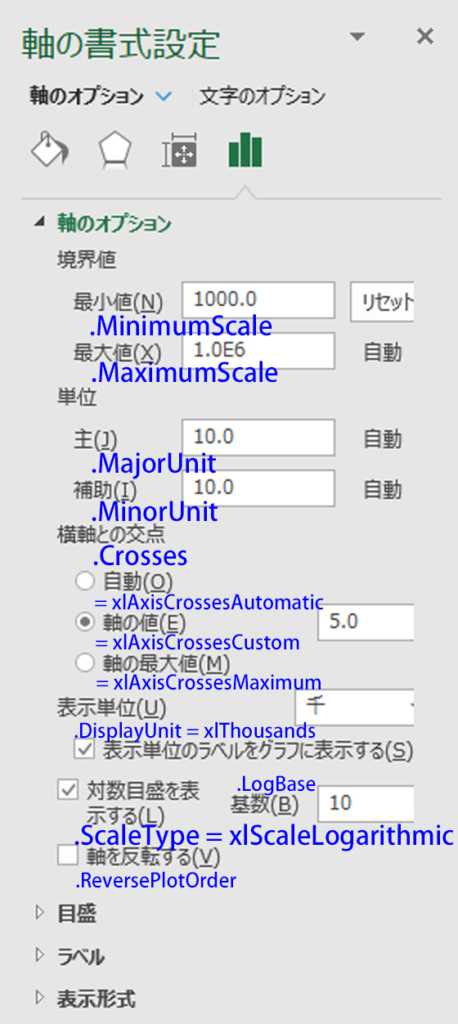
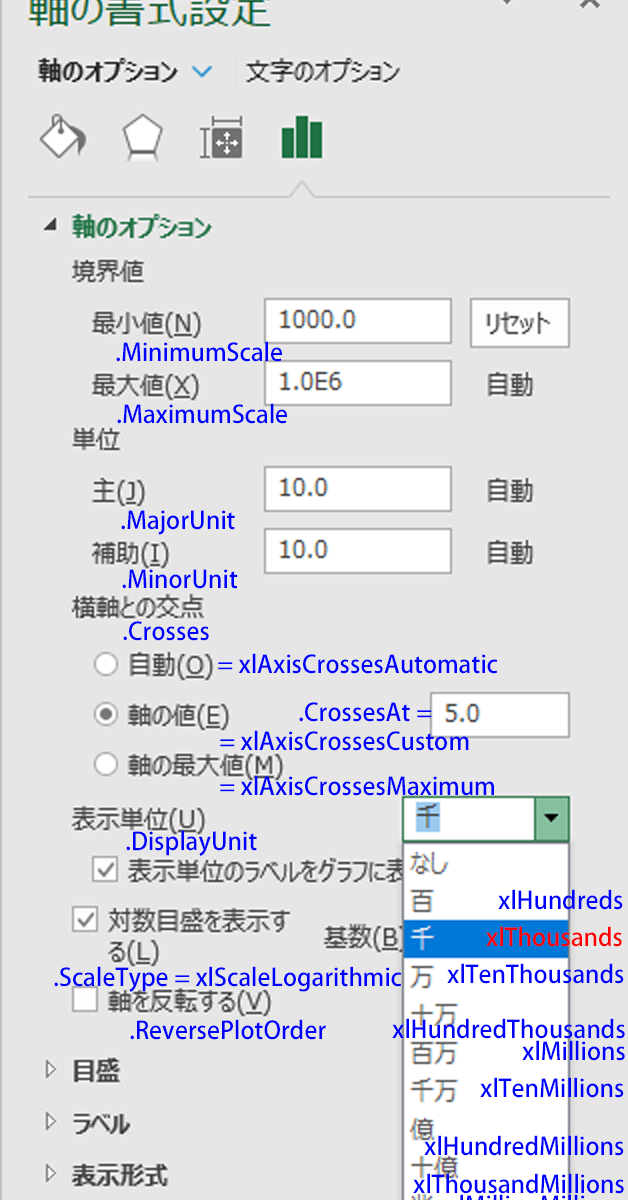
「軸のオプション」パネルが開く.ここはデータの本質にかかわる作業となる.下図に Axis オブジェクトのプロパティを記しておく.ここでは軸の最小値,最大値,単位,横軸との交点,表示単位,対数目盛の表示,軸の反転について設定する.

軸のフォントの設定
Y 軸を選択した状態で右クリックし「フォント…」を選ぶ.

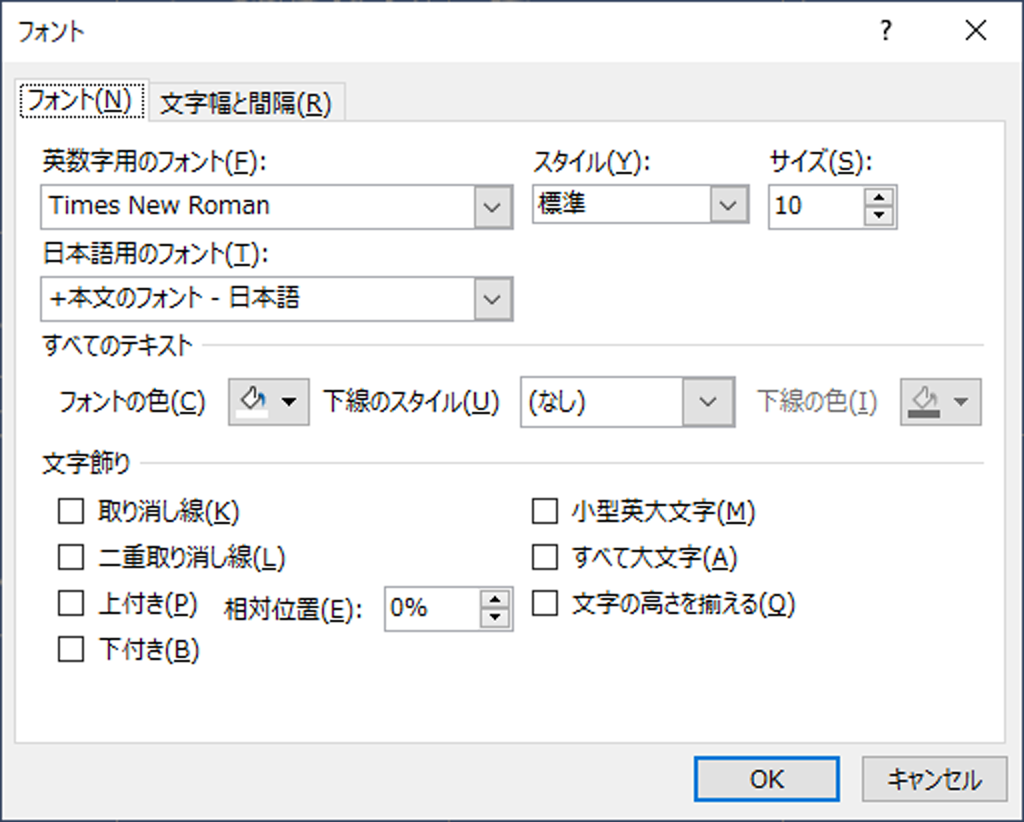
「フォント」ダイアログが開く.色が白色であることを確認するだけなので特に設定はしない.

最初のコードが動かない!
下のコードがマクロの記録で得られたものである.重要なオブジェクト間の繋がりは 3 行目と 4 行目,さらに 12 行目にありそうだ.
実際には 4 行目から 11 行目では軸のフォントの色を変更し,12 行目から 15 行目では軸のフォントを変更している.
Sub Macro1()
    ActiveSheet.ChartObjects("グラフ 1").Activate
    ActiveChart.Axes(xlValue).Select
    With Selection.Format.TextFrame2.TextRange.Font.Fill
        .Visible = msoTrue
        .ForeColor.ObjectThemeColor = msoThemeColorBackground1
        .ForeColor.TintAndShade = 0
        .ForeColor.Brightness = 0
        .Transparency = 0
        .Solid
    End With
    With Selection.Format.TextFrame2.TextRange.Font
        .BaselineOffset = 0
        .Name = "Times New Roman"
    End With
End Sub
しかし,このコードをそのまま実行しても実行時エラーが返ってくる.

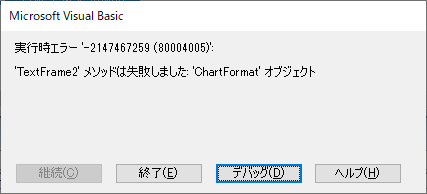
デバッグ画面に切り替わり,エラーの出たコードがハイライトされている.

問題の切り分けにはオブジェクトを一つづつ切り分ける
実行時エラーは大抵の場合,オブジェクトの取得がうまく行っていない時に起こりやすい.そこで,TypeName 関数を使ってどこで取得に失敗しているのか切り分ける作業に入る.
最後のオブジェクトから始める人と,最初のオブジェクトから始める人がいる.どちらでも構わないが,俺は最初のオブジェクトから始める方だ.
Select と Selection は消す

マクロの記録に特有の記述だ.頭に With をつけて,ここはさっさと消してしまう.これは形式的作業だ.

With ActiveChart.Axes(xlValue).Format.TextFrame2.TextRange.Font.Fill
TypeName 関数でオブジェクトを取得できているか調べる
上記コードのオブジェクト数は 7 個ある.そこで TypeName 関数を 7 個並べる.
Sub TEST1()
ActiveSheet.ChartObjects("グラフ 1").Activate

Debug.Print TypeName()
Debug.Print TypeName()
Debug.Print TypeName()
Debug.Print TypeName()
Debug.Print TypeName()
Debug.Print TypeName()
Debug.Print TypeName()
End Sub
次に最初のオブジェクトから始めて,一つずつオブジェクトを増やしていく.次のようになる.
Sub TEST1()
ActiveSheet.ChartObjects("グラフ 1").Activate

Debug.Print TypeName(ActiveChart)
Debug.Print TypeName(ActiveChart.Axes(xlValue))
Debug.Print TypeName(ActiveChart.Axes(xlValue).Format)
Debug.Print TypeName(ActiveChart.Axes(xlValue).Format.TextFrame2)
Debug.Print TypeName(ActiveChart.Axes(xlValue).Format.TextFrame2.TextRange)
Debug.Print TypeName(ActiveChart.Axes(xlValue).Format.TextFrame2.TextRange.Font)
Debug.Print TypeName(ActiveChart.Axes(xlValue).Format.TextFrame2.TextRange.Font.Fill)
End Sub
結果
7 行目の TextFrame2 オブジェクトの取得に失敗する.
Chart
Axis
ChartFormat

ChartFormat オブジェクトと TextFrame2 オブジェクトが繋がらない!
オブジェクトブラウザーからは確かに繋がっており,コンパイルエラーも発生していないのに,実行してみるとエラーとなる.何かがおかしい.
何度か試行錯誤してみたが,どうもこの経路は行き止まりのようで埒があかない.
そもそも VBA でオブジェクトを取得するのに唯一の経路しか存在しないということはまれで,普通はいくつかの複数の経路が存在する.他の経路から辿れないか?こういう時は検索してみる.
Google 検索
検索キーワードはもちろん “ChartFormat” “TextFrame2” の AND 検索である.ダブルクオーテーションで囲うのは完全一致を意図している.どうやら他にも意図せざるエラーで悩んでいる人がいるらしいことが分かる.
Excelで作成したグラフの縦軸,横軸の目盛り(数値)のフォントを変えるマクロがうまくいかない
Chart オブジェクトと ChartFormat オブジェクトの間にいた伏兵,それは ChartArea オブジェクト
見落としていたオブジェクトである.オブジェクトブラウザーからは見つけられなかった.これを間に入れることで実行時エラーが解消された.
オブジェクトは
Chart.ChartArea.ChartFormat.TextFrame2.TextRange2.Font2.FillFormat
と繋がる.
オブジェクト名から想像できるように,この設定はグラフ全体に及ぶ.軸を特定していないからである.
TickLabels オブジェクト
軸を特定して書式設定したい場合には TickLabels オブジェクトを取得する.
Chart.ChartFormat.Axis.TickLabels.Font.ColorFormat
と繋がる.
テストコード
オブジェクトを順につないでいく.確認のために,取得するたびにオブジェクトの種類をイミディエイトウィンドウに出力している.宣言している変数がすべて Object 型であることに注意されたい.
Sub TEST()
Dim myCht       As Object

Dim myFmt       As Object
Dim myAxis      As Object
Dim myTckLbl    As Object
Dim myFont      As Object

Dim myChtArea   As Object
Dim myFmt2      As Object
Dim myTxtFrm    As Object
Dim myObj       As Object

Set myCht = Worksheets("散布図").ChartObjects(1).Chart
Debug.Print TypeName(myCht)

Set myFmt = myCht.Axes(xlValue).Format
Debug.Print TypeName(myFmt)

Set myAxis = myCht.Axes(xlValue)
Debug.Print TypeName(myAxis)

Set myTckLbl = myAxis.TickLabels
Debug.Print TypeName(myTckLbl)

Set myFont = myTckLbl.Font
Debug.Print TypeName(myFont)

Debug.Print TypeName(myFont.Color), myFont.Color

'==============================

Set myChtArea = myCht.ChartArea
Debug.Print TypeName(myChtArea)

Set myFmt2 = myChtArea.Format
Debug.Print TypeName(myFmt2)

Set myTxtFrm = myFmt2.TextFrame2
Debug.Print TypeName(myTxtFrm)

Set myObj = myTxtFrm.TextRange
Debug.Print TypeName(myObj)

Set myObj = myObj.Font
Debug.Print TypeName(myObj)

Set myObj = myObj.Fill
Debug.Print TypeName(myObj)

End Sub
テスト結果
間違いなくオブジェクトがすべて取得できていることが分かる.
Chart
ChartFormat
Axis
TickLabels
Font
Long           5855577
ChartArea
ChartFormat
TextFrame2
TextRange2
Font2
FillFormat
『EXCEL VBAできる大事典』で発見
EXCEL VBAできる大事典 の「グラフの軸を設定するには (p678)」に記述があった.Chart オブジェクトと Axis オブジェクトとの間に ChartFormat オブジェクトがないのが気になる.
Chart.Axis.TickLabels
テストコードその2
気になるのでテストしてみる.
Sub TEST2()
Dim myCht   As Chart
Set myCht = ActiveSheet.ChartObjects(1).Chart

Debug.Print TypeName(myCht.Axes(xlValue).TickLabels), myCht.Axes(xlValue).TickLabels.Orientation
Debug.Print TypeName(myCht.Axes(xlValue).TickLabels.Font), myCht.Axes(xlValue).TickLabels.Font.Name

End Sub
どうやら取得できているようだ.
TickLabels    -4105
Font          游ゴシック
再びオブジェクトブラウザーに戻る
TickLabels オブジェクト
TickLabels はグラフ軸の目盛りにアクセスするためのオブジェクトである.下記はオブジェクトブラウザーで調べたメンバーの一覧である.
| CLASS | MEMBER | Type of Return |
|---|---|---|
| TickLabels | Alignment | Long |
| Application | Application | |
| Creator | XlCreator | |
| Delete | Function | |
| Depth | Long | |
| Font | Font | |
| Format | ChartFormat | |
| MultiLevel | Boolean | |
| Name | String | |
| NumberFormat | String | |
| NumberFormatLinked | Boolean | |
| NumberFormatLocal | Variant | |
| Offset | Long | |
| Orientation | XlTickLabelOrientation | |
| Parent | Object | |
| ReadingOrder | Long | |
| Select | Function |
Axis オブジェクト
グラフの軸を操作するには Axis オブジェクトを取得する.
| CLASS | MEMBER | Type of Return |
|---|---|---|
| Axis | AxisBetweenCategories | Boolean |
| AxisGroup | XlAxisGroup | |
| AxisTitle | AxisTitle | |
| BaseUnit | XlTimeUnit | |
| BaseUnitIsAuto | Boolean | |
| Border | Border | |
| CategoryNames | Variant | |
| CategorySortOrder | XlCategorySortOrder | |
| CategoryType | XlCategoryType | |
| Creator | XlCreator | |
| Crosses | XlAxisCrosses | |
| CrossesAt | Double | |
| Delete | Function | |
| DisplayUnit | XlDisplayUnit | |
| DisplayUnitCustom | Double | |
| DisplayUnitLabel | DisplayUnitLabel | |
| Format | ChartFormat | |
| GetProperty | Function | |
| HasDisplayUnitLabel | Boolean | |
| HasMajorGridlines | Boolean | |
| HasMinorGridlines | Boolean | |
| HasTitle | Boolean | |
| Height | Double | |
| Left | Double | |
| LogBase | Double | |
| MajorGridlines | Gridlines | |
| MajorTickMark | XlTickMark | |
| MajorUnit | Double | |
| MajorUnitIsAuto | Boolean | |
| MajorUnitScale | XlTimeUnit | |
| MaximumScale | Double | |
| MaximumScaleIsAuto | Boolean | |
| MinimumScale | Double | |
| MinimumScaleIsAuto | Boolean | |
| MinorGridlines | Gridlines | |
| MinorTickMark | XlTickMark | |
| MinorUnit | Double | |
| MinorUnitIsAuto | Boolean | |
| MinorUnitScale | XlTimeUnit | |
| Parent | Object | |
| ReversePlotOrder | Boolean | |
| ScaleType | XlScaleType | |
| Select | Function | |
| SetProperty | Sub | |
| TickLabelPosition | XlTickLabelPosition | |
| TickLabels | TickLabels | |
| TickLabelSpacing | Long | |
| TickLabelSpacingIsAuto | Boolean | |
| TickMarkSpacing | Long | |
| Top | Double | |
| Type | XlAxisType | |
| Width | Double |
軸の交点は Axis.Crosses プロパティで設定する
マクロの記録だけでは気がつかない罠の一つである.オブジェクトブラウザーを丹念に見直して気がついた.
グラフによっては X 軸を上端に寄せたいとか Y 軸を左端に寄せたいとかいう要望もあるだろう.その時はこのプロパティを設定するのである.
| MEMBER | VALUE | Description |
|---|---|---|
| xlAxisCrossesAutomatic | -4105 | 交差する点は自動 |
| xlAxisCrossesCustom | -4114 | CrossesAtプロパティの値で交差 |
| xlAxisCrossesMaximum | 2 | 最大値で交差 |
| xlAxisCrossesMinimum | 4 | 最小値で交差 |
対数軸は Axis.ScaleType プロパティで設定する
軸を線形で表示するか対数で表示するかはこのプロパティで設定する.
| MEMBER | VALUE | Description |
|---|---|---|
| xlScaleLinear | -4132 | Linear |
| xlScaleLogarithmic | -4133 | Logarithmic |
Font オブジェクトと Font2 オブジェクト
オブジェクトブラウザーでプロパティを調べてみると,両者の違いが何となく分かってくる.Font オブジェクトのプロパティはほとんどが Variant 型であるのに対して,Font2 オブジェクトのプロパティは型が決まっている.
恐らく初期に実装した Font オブジェクトの仕様を変更できずに,新しく Font2 オブジェクトを作ることにしたのだろう.プロパティの数だけでも Font2 オブジェクトが 36 個に対して Font オブジェクトは 18 個しかない.
フォントについては後日別記事で取り上げることにする.
テストコードその3
これまで見てきたオブジェクトのメンバーを出力している.
Sub TEST3()
Dim myCht       As Chart

Set myCht = ActiveSheet.ChartObjects(1).Chart

With myCht
    Debug.Print TypeName(myCht)
    Debug.Print ".Name", .Name

With .ChartArea
    Debug.Print TypeName(myCht.ChartArea)
    Debug.Print ".Name", .Name
    Debug.Print ".Left", .Left
    Debug.Print ".Top", .Top
    Debug.Print ".Width", .Width
    Debug.Print ".Height", .Height
End With

Debug.Print "==============================="

With .PlotArea
    Debug.Print TypeName(myCht.PlotArea)
    Debug.Print ".Name", .Name
    Debug.Print ".Left", .Left
    Debug.Print ".Top", .Top
    Debug.Print ".Width", .Width
    Debug.Print ".Height", .Height
    Debug.Print ".InsideLeft", .InsideLeft
    Debug.Print ".InsideTop", .InsideTop
    Debug.Print ".InsideWidth", .InsideWidth
    Debug.Print ".InsideHeight", .InsideHeight
End With

Debug.Print "==============================="

With .Axes(xlCategory)
    Debug.Print TypeName(myCht.Axes(xlCategory))
    Debug.Print ".Type", .Type
    Debug.Print ".ScaleType", .ScaleType
    Debug.Print ".MaximumScale", .MaximumScale
    Debug.Print ".MinimumScale", .MinimumScale
    Debug.Print ".Crosses", .Crosses
    Debug.Print ".HasTitle", .HasTitle
    Debug.Print ".Left", .Left
    Debug.Print ".Top", .Top
    Debug.Print ".Width", .Width
    Debug.Print ".Height", .Height

With .TickLabels
    Debug.Print TypeName(myCht.Axes(xlCategory).TickLabels)
    Debug.Print , TypeName(.Font)
    Debug.Print , ".Font.Name", .Font.Name
    Debug.Print , ".Font.Size", .Font.Size
    Debug.Print , ".Font.Color", .Font.Color
    Debug.Print , ".Font.Bold", .Font.Bold
    Debug.Print , ".Font.FontStyle", .Font.FontStyle
    Debug.Print ".Name", .Name
    Debug.Print ".NumberFormat", .NumberFormat
    Debug.Print ".NumberFormatLinked", .NumberFormatLinked
    Debug.Print ".NumberFormatLocal", .NumberFormatLocal
    Debug.Print ".Offset", .Offset
    Debug.Print ".Orientation", .Orientation
    Debug.Print ".ReadingOrder", .ReadingOrder
    Debug.Print ".Depth", .Depth

End With
End With

Debug.Print "==============================="

With .Axes(xlValue)
    Debug.Print TypeName(myCht.Axes(xlValue))
    Debug.Print ".Type", .Type
    Debug.Print ".ScaleType", .ScaleType
    Debug.Print ".MaximumScale", .MaximumScale
    Debug.Print ".MinimumScale", .MinimumScale
    Debug.Print ".LogBase", .LogBase
    Debug.Print ".Crosses", .Crosses
    Debug.Print ".HasTitle", .HasTitle
    Debug.Print ".Left", .Left
    Debug.Print ".Top", .Top
    Debug.Print ".Width", .Width
    Debug.Print ".Height", .Height
With .TickLabels
    Debug.Print TypeName(myCht.Axes(xlValue).TickLabels)
    Debug.Print , TypeName(.Font)
    Debug.Print , ".Font.Name", .Font.Name
    Debug.Print , ".Font.Size", .Font.Size
    Debug.Print , ".Font.Color", .Font.Color
    Debug.Print , ".Font.Bold", .Font.Bold
    Debug.Print , ".Font.FontStyle", .Font.FontStyle
    Debug.Print ".Name", .Name
    Debug.Print ".NumberFormat", .NumberFormat
    Debug.Print ".NumberFormatLinked", .NumberFormatLinked
    Debug.Print ".NumberFormatLocal", .NumberFormatLocal
    Debug.Print ".Offset", .Offset
    Debug.Print ".Orientation", .Orientation
    Debug.Print ".ReadingOrder", .ReadingOrder
    Debug.Print ".Depth", .Depth

End With
End With

End With

End Sub
イミディエイトウィンドウには下記のように出力される.出力結果は各自の環境で異なる.Y 軸は対数表記にしてあるため .LogBase プロパティがエラーにならない.
Chart
.Name         散布図 グラフ 1
ChartArea
.Name         グラフ
.Left          0
.Top           0
.Width         795
.Height        795
===============================
PlotArea
.Name         プロット
.Left          26.73
.Top           39.43
.Width         758.27
.Height        745.57
.InsideLeft    26.73
.InsideTop     39.43
.InsideWidth   750.022519685039
.InsideHeight  734.758346456693
===============================
Axis
.Type          1
.ScaleType    -4132
.MaximumScale  0.3
.MinimumScale -0.3
.Crosses      -4105
.HasTitle     False
.Left          27
.Top           774
.Width         750
.Height        17
TickLabels
              Font
              .Font.Name    游ゴシック
              .Font.Size     9
              .Font.Color    16777215
              .Font.Bold    False
              .Font.FontStyle             Regular
.Name         軸 2
.NumberFormat 0%
.NumberFormatLinked         False
.NumberFormatLocal          0%
.Offset        100
.Orientation  -4105
.ReadingOrder -5002
.Depth         0
===============================
Axis
.Type          2
.ScaleType    -4133
.MaximumScale  1000000
.MinimumScale  1000
.LogBase       10
.Crosses      -4114
.HasTitle     False
.Left          368
.Top           39
.Width         34
.Height        735
TickLabels
              Font
              .Font.Name    游ゴシック
              .Font.Size     9
              .Font.Color    16777215
              .Font.Bold    False
              .Font.FontStyle             Regular
.Name         軸 1
.NumberFormat General
.NumberFormatLinked         True
.NumberFormatLocal          G/標準
.Offset        100
.Orientation  -4105
.ReadingOrder -5002
.Depth         0
Chart.SetElement メソッドを使いこなせ
Microsoft Excel 2019 VBA and Macros (Business Skills) の p 314 以降に記述があるが,Chart オブジェクトの .SetElement メソッドを使うと,列挙型を指定することでグラフのオブジェクトを指定せずとも一発で設定できる.
例えば Y 軸を対数表記にしたい場合は,下記のように記述するのが普通だ.
With Chart.Axes(XlValue)
    .ScaleType = xlScaleLogarithmic
End with
ところが,Chart.SetElement メソッドを使うと Axis オブジェクトを取得する必要がない.
With Chart
    .SetElement msoElementPrimaryValueAxisLogScale
End with
列挙型を知っていると,こういうチートが使える.MsoChartElementType という言葉をオブジェクトブラウザーで検索してみてほしい.設定できるオブジェクトは以下のようだ.
- Axis
- AxisTitle
- DataTable
- ErrorBar
- Gridline
- Legend
- Line
- PlotArea
- Trendline
- Up/DownBars


“EXCELのグラフの軸の書式設定でハマる” への1件の返信