「全国の自治体の人口動態を時系列で一枚の散布図に示す」というプロジェクトを自分で掲げたのであるが,その過程で EXCEL の仕様や制約を通じて EXCEL を理解するという段階に至った.
今回は散布図の要素である系列の点と線について述べる.
点は Series.Point
系列の書式で最初に変更するのはおそらく点,つまり Point オブジェクトだろう.マーカーのスタイル,サイズ,前景色と背景色であるはずだ.
それぞれ .MarkerStyle, .MarkerSize, .MarkerForegroundColor, .MarkerBackgroundColor プロパティに該当する.

.MarkerStyle プロパティ
マーカースタイルとは点の形のことである.XlMarkerStyle 列挙型から選択する.折れ線グラフ,散布図またはレーダーチャートにのみ適用される.
| MEMBER | CONST | Description |
|---|---|---|
| xlMarkerStyleAutomatic | -4105 | 自動 |
| xlMarkerStyleNone | -4142 | なし |
| xlMarkerStyleSquare | 1 | 四角形 |
| xlMarkerStyleDiamond | 2 | ひし形 |
| xlMarkerStyleTriangle | 3 | 三角形 |
| xlMarkerStyleX | -4168 | X 印付きの四角形 |
| xlMarkerStyleStar | 5 | アスタリスク付きの四角形 |
| xlMarkerStyleDot | -4118 | 短い棒 |
| xlMarkerStyleDash | -4115 | 長い棒 |
| xlMarkerStyleCircle | 8 | 円形 |
| xlMarkerStylePlus | 9 | 正符号 (+) 付きの四角形 |
| xlMarkerStylePicture | -4147 | 画像 |
.MarkerSize プロパティ
Long 型つまり整数で設定する.指定可能な範囲は 2 – 72 である.
.MarkerForegroundColor プロパティ
マーカーの前景色を RGB 値として Long 型つまり整数で設定する.
折れ線グラフ,散布図,レーダーチャートにのみ適用可能である.
With Charts("Chart1").SeriesCollection(1).Points(2)
 .MarkerBackgroundColor = RGB(0,255,0) ' green
 .MarkerForegroundColor = RGB(255,0,0) ' red
End With
.MarkerForegroundColorIndex プロパティ
ややこしいのであるが,同じ前景色を指定する際にインデックスで指定することもできる.現在のカラーパレットのインデックスとして設定するか XlColorIndex 列挙型の定数として指定するかのいずれかである.
XlColorIndex 列挙型のメンバーは xlColorIndexAutomatic または xlColorIndexNone の 2 種類の列挙型のみである.
| MEMBER | CONST | Description |
|---|---|---|
| xlColorIndexAutomatic | -4105 | 自動 |
| xlColorIndexNone | -4142 | 色なし |
折れ線グラフ,散布図,レーダーチャートにのみ適用可能である.
With Charts("Chart1").SeriesCollection(1).Points(2)
 .MarkerBackgroundColorIndex = 4 'green
 .MarkerForegroundColorIndex = 3 'red
End With
.MarkerBackgroundColor プロパティ
マーカーの背景色を Long 型つまり整数で設定する.RGB 値としてマーカーの背景色を設定する.
折れ線グラフ,散布図,レーダーチャートにのみ適用可能である.
.MarkerBackgroundColorIndex プロパティ
現在のカラーパレットのインデックスとして設定するか,または次の XlColorIndex 定数で指定する.XlColorIndex 定数のメンバーは xlColorIndexAutomatic または xlColorIndexNone の 2 種類から指定できるのみである.
折れ線グラフ,散布図,レーダーチャートにのみ適用可能である.
点と点を結ぶ線は Sereis.Format.Line
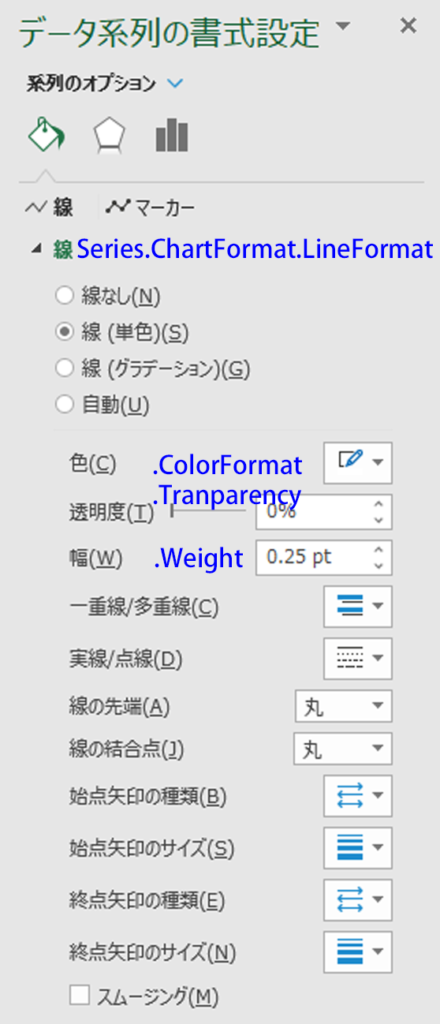
点の次に変更するのはおそらく線,つまり Line オブジェクトだろう.ここへは Series オブジェクトの Format プロパティ(ChartFormat オブジェクト)から Line プロパティ(LineFormat オブジェクト)と辿ることで取得できる.
変更するのは線の色,太さあたりだろうか.

ChartFormat オブジェクト
ChartFormat オブジェクトには 13 個のプロパティがある.メソッドはない.本記事では Line プロパティを取得して LineFormat オブジェクトに到達する目的で取り上げているが,他にも用途はありそうだ.
| CLASS | MEMBER | Type of Return |
|---|---|---|
| ChartFormat | Adjustments | Adjustments |
| Application | Application | |
| AutoShapeType | MsoAutoShapeType | |
| Creator | XlCreator | |
| Fill | FillFormat | |
| Glow | GlowFormat | |
| Line | LineFormat | |
| Parent | Object | |
| PictureFormat | PictureFormat | |
| Shadow | ShadowFormat | |
| SoftEdge | SoftEdgeFormat | |
| TextFrame2 | TextFrame2 | |
| ThreeD | ThreeDFormat |
LineFormat オブジェクト
LineFormat オブジェクトには 18 個のプロパティがある.メソッドはない.
色に関しては ForeColor プロパティと BackColor プロパティがある.太さは Weight プロパティを小数で指定する.透明度は Tranparency プロパティを小数で指定する.
| CLASS | MEMBER | Type of Return |
|---|---|---|
| LineFormat | Application | Object |
| BackColor | ColorFormat | |
| BeginArrowheadLength | MsoArrowwheadLength | |
| BeginArrowheadStyle | MsoArrowheadStyle | |
| BeginArrowheadWidth | MsoArrowheadWidth | |
| Creator | Long | |
| DashStyle | MsoLineDashStyle | |
| EndArrowheadLength | MsoArrowheadLength | |
| EndArrowheadStyle | MsoArrowheadStyle | |
| EndArrowheadWidth | MsoArrowheadWidth | |
| ForeColor | ColorFormat | |
| InsetPen | MsoTriState | |
| Parent | Object | |
| Pattern | MsoPatternType | |
| Style | MsoLineStyle | |
| Transparency | Single | |
| Visible | MsoTriState | |
| Weight | Single |
ColorFormat オブジェクト
LineFormat オブジェクトから ForeColor プロパティまたは BackColor プロパティを経由して ColorFormat オブジェクトを取得する.9 個のプロパティがある.
| CLASS | MEMBER | Type of Return |
|---|---|---|
| ColorFormat | Application | Object |
| Brightness | Single | |
| Creator | Long | |
| ObjectThemeColor | MsoThemeColorIndex | |
| Parent | Object | |
| RGB | MsoRGBType | |
| SchemeColor | Long | |
| TintAndShade | Single | |
| Type | MsoColorType |
次のサンプルコードでは 2 行目から 8 行目で系列のマーカー全てのサイズを 2 ポイントに設定しているが,10 行目で最後のマーカーだけサイズを 3 ポイントに変えている.こういう芸当はユーザーインターフェースでは難しく,コーディングが必要になる.
With mySeries
    For Each myPoint In .Points
        With myPoint
            .MarkerStyle = xlMarkerStyleCircle
            .MarkerSize = 2
            .MarkerBackgroundColor = RGB(255, 255, 255)
        End With
    Next myPoint

    .Points(.Points.Count).MarkerSize = 3

    With .Format.Line
        .Weight = 0.25
        .ForeColor.RGB = RGB(255, 255, 255)
    End With
End With
配色に関して
EXCEL に限らず Office での配色は指定方法がいくつか存在する.テーマの色から指定する方法,純粋な色を指定する方法など.このあたりは嵌るところなので,機会を見ていずれ調べたい.
ObjectThemeColor プロパティ
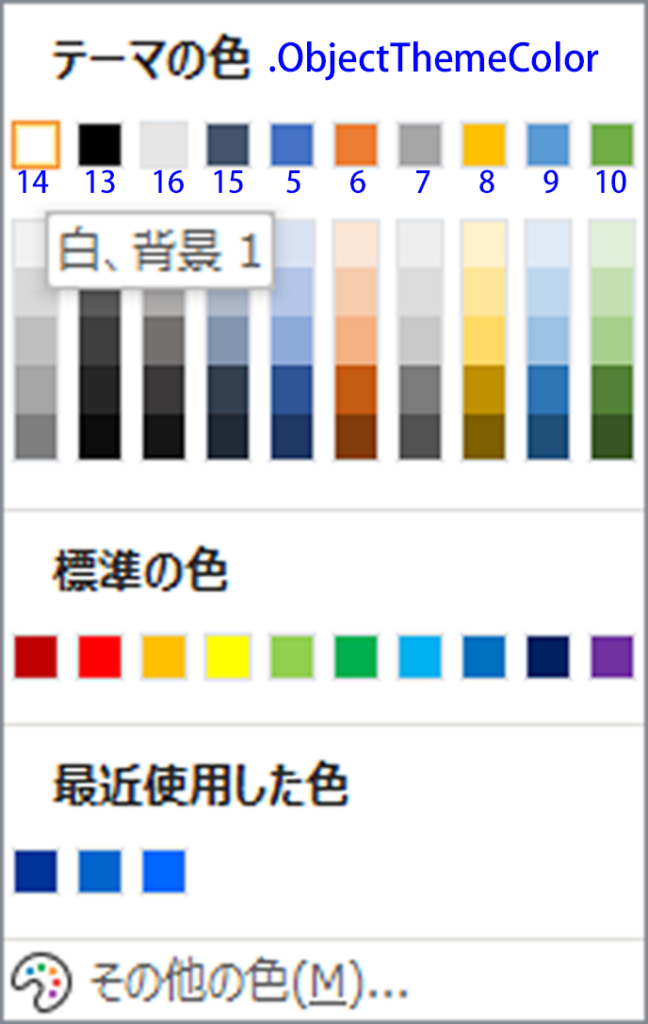
ObjectThemeColor プロパティが出てきたので触れておこう.テーマの配色にマップされる色のことである.MsoThemeColorIndex 列挙型から選択する.

| MEMBER | CONST | Description |
|---|---|---|
| msoThemeColorBackground1 | 14 | 背景 1 |
| msoThemeColorText1 | 13 | テキスト 1 |
| msoThemeColorBackground2 | 16 | 背景 2 |
| msoThemeColorText2 | 15 | テキスト 2 |
| msoThemeColorAccent1 | 5 | アクセント 1 |
| msoThemeColorAccent2 | 6 | アクセント 2 |
| msoThemeColorAccent3 | 7 | アクセント 3 |
| msoThemeColorAccent4 | 8 | アクセント 4 |
| msoThemeColorAccent5 | 9 | アクセント 5 |
| msoThemeColorAccent6 | 10 | アクセント 6 |
| msoNotThemeColor | 0 | 色を指定しない |
| msoThemeColorDark1 | 1 | 濃色 1 |
| msoThemeColorLight1 | 2 | 淡色 1 |
| msoThemeColorDark2 | 3 | 濃色 2 |
| msoThemeColorLight2 | 4 | 淡色 2 |
| msoThemeColorHyperlink | 11 | ハイパーリンク |
| msoThemeColorFollowedHyperlink | 12 | クリックされたハイパーリンク |
| msoThemeColorMixed | -2 | テーマの色の組み合わせ |


“VBA から見た EXCEL の散布図の点と線” への2件の返信